The HTP Analytics - Inventory Interactions chart gives you details on what interactions users are taking on your listings, as well as how they’re showing up in search results and where those searches are converting into actions.
.png?cb=407e820d53d0f396fc8d7f98f479574d)
The Inventory Interactions chart contains a lot of detail. For the best performance, it is recommended that you only run this report for a week’s worth of data at a time.
👁️ Views
A Part Detail View is counted when a user looks at a part’s detail screen. It is not counted when the part shows in search results. A user could open a part from a web search, social media post, searching within HeavyTruckParts.Net, and more. If a user opens a part’s detail screen more than once, it will count as multiple views.
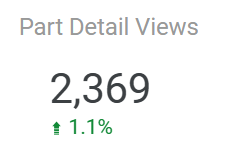
Part Detail Views - Sums the total part detail views in the time period. The comparison below the total indicates how this number has changed since the last time period.
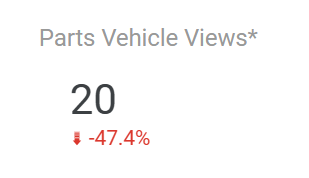
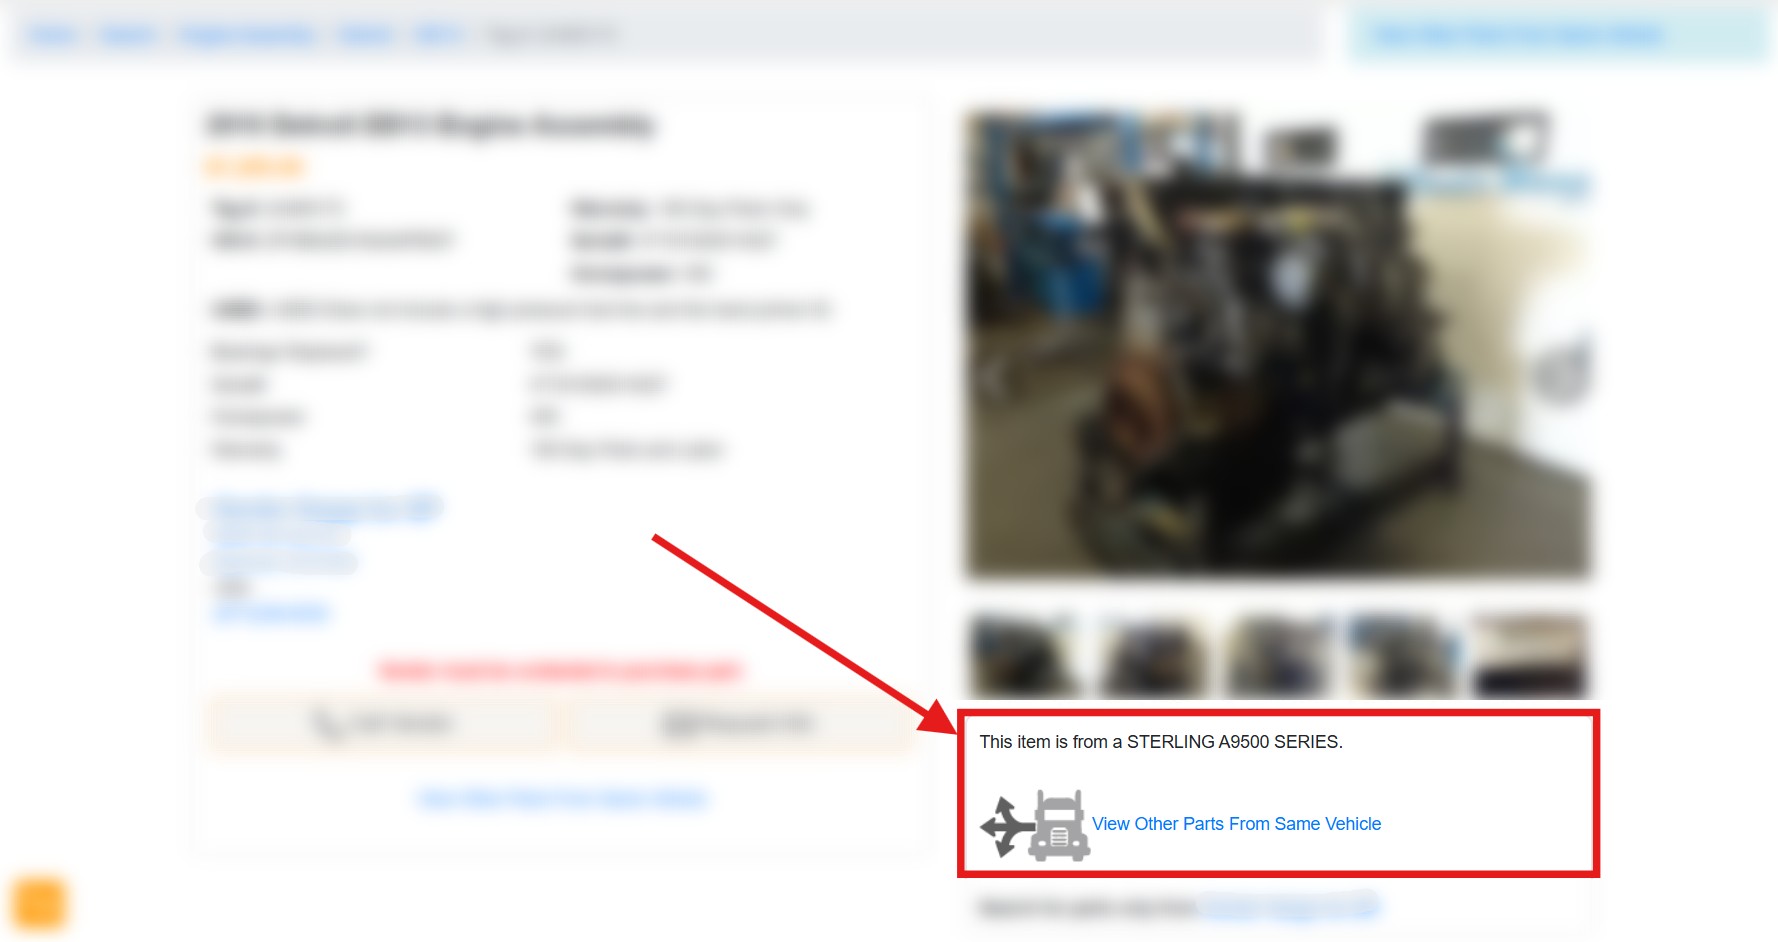
Parts Vehicle Views* - Counts the total number of times a user has clicked View Other Parts From Same Vehicle while looking at a part. This option is only available when a series of parts are associated to a vehicle in ITrack. The comparison below the total indicates how this number has changed since the last time period. *Data from this metric is unavailable prior to July 31, 2025 when tracking was added.
📱 Phone Clicks and Info Requests
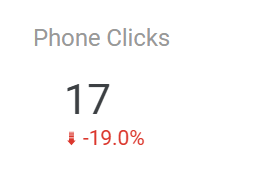
Phone Clicks - The total number of times a user has clicked the Call Vendor button on a part, either in the Part Detail page or from a search result list. The comparison below the total indicates how this number has changed since the last time period.
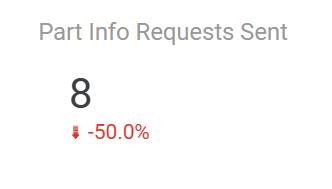
Part Info Requests Sent - The total number of times a user has clicked the Request Info button on a part, either in the Part Detail page or from a search result list, and the user sent a message. The comparison below the total indicates how this number has changed since the last time period.
🔎 Inventory Interactions and Search Conversions
The Inventory Interactions and Search Conversions table shows you which parts have appeared in searches on HeavyTruckParts.Net in the time period on the report. It will also show you if those search results have lead to user interactions such as opening a part’s details or clicking the call or request info buttons on a part. It will also show you if a user found a part from an external search engine, and name that source.
Click on any column header to sort the report by that column.
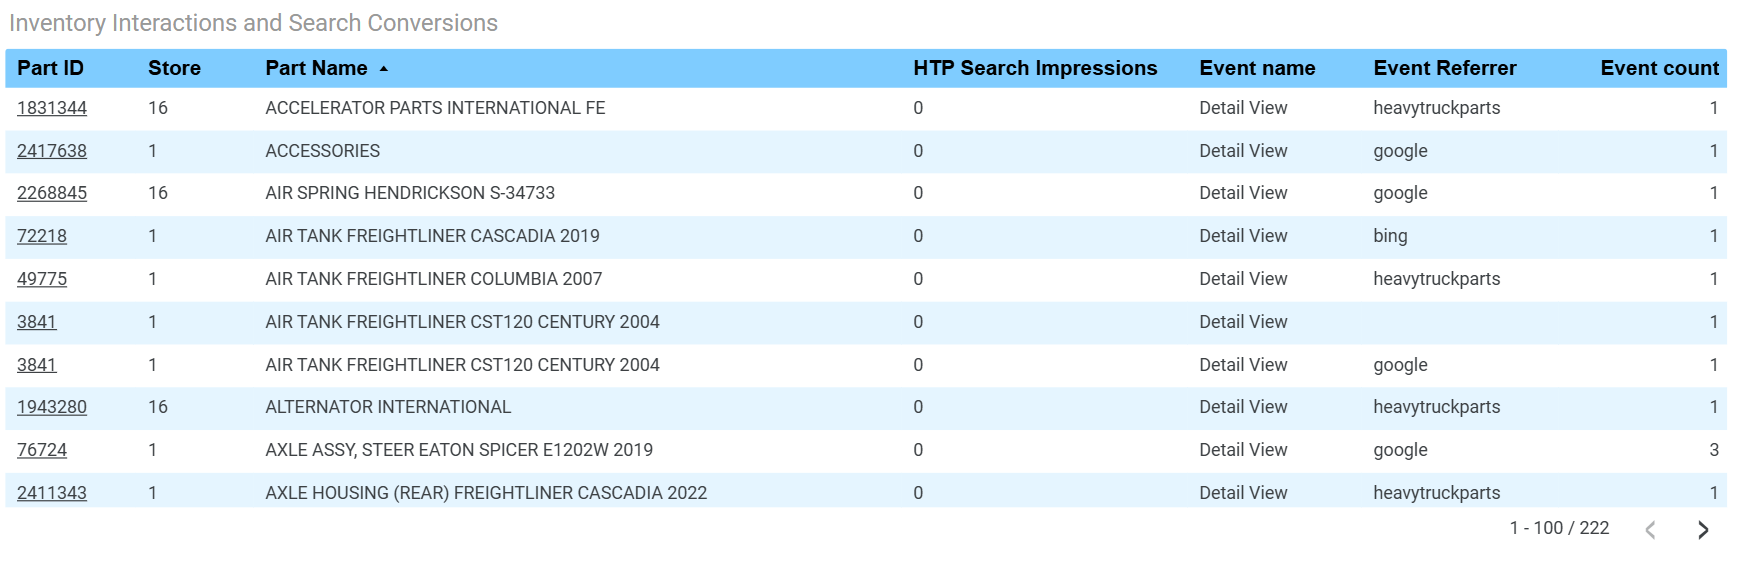
Part ID - The unique ID assigned to the part on HeavyTruckParts.Net. This is not the same as your part’s tag number. The Part ID is also a link; click the link to open the listing on HeavyTruckParts.Net.
Store - The Store number this part is stocked at.
Part Name - The name of the part listing on HeavyTruckParts.Net.
HTP Search Impressions - The number of times the part has appeared in a search on HeavyTruckParts.Net. This does not count times the part has appeared in search results from an external search engine such as Google or Bing.
Event Name - If the user interacted with a part, this shows what action the user took. Some examples include:
Detail View - The user opened the part’s detail screen.
Map Click - The user clicked your store’s address from the part detail screen to open a map to your store.
Vendor Click - The user clicked your vendor name on a part detail screen.
Add to Cart - If you’re using HeavyTruckParts.Net’s add-to-cart feature, and a user clicked to add the item to their cart.
Part Inquiry - The user clicked Request Info on a part and sent a message.
Phone Click - The user clicked the Call Vendor button on a part.
Event Referrer - When a user takes an action, this shows what page a user was on before taking that action. For example, if a user is on HeavyTruckParts.Net and clicks to open a part detail, the event referrer will be heavytruckparts. If a user finds a part via a Google search and opens that part listing, the event referrer will be google.
Event Count - The number of times the event occurred on that listing within the time period of the report.
Tracking data is imprecise, and users might opt out of tracking. If a part has an Event and the Event Referrer is blank, that usually indicates the user opted out of tracking or was browsing anonymously.
🧠 Interpreting this Data
🔎 A Search With No Conversion

A part might have a value in HTP Search Impressions but no event information. When this happens, that means the part appeared to a user in a search on HeavyTruckParts.Net but the user didn’t interact with or click on that part. In the example above, the part appeared in a search result twice.
➡️ A Search With A Conversion

A part might have a value in HTP Search Impressions and an event. If the Event Referrer is heavytruckparts, this means the listing appeared in a search for a user, and that resulted in a user interacting with that listing. In the example above, the part appeared in a search result twice, and the part’s Detail View was viewed four times. Since the Event Referrer was heavytruckparts, this means the user interacted with the search result on HeavyTruckParts.Net.
👁️ Views from 3rd Party Searches
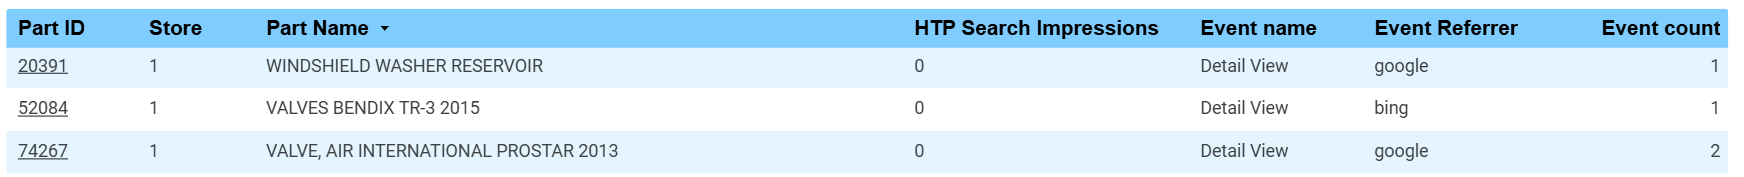
A part might have no HTP Search Impressions, but still result in views and interactions. This happens when a user finds a listing from a source outside of HeavyTruckParts.Net, such as a search engine, social media posting, or some other link to the part listing. In the example above, the listings have a few views from google and bing.
📄 Individual Parts With Multiple Rows
A part might show up in the table more than once, and appear on more than one row for a variety of reasons. This means that something in one of the columns differs between the different rows. This could happen if a part is listed at more than one Store, has had more than one type of interaction (Event Name), or events from different Event Referrers.

In the example above, the same PTO CLARK part shows on two rows, because it had Detail View events from different Event Referrers. In this case, 6 views came from a bing search, and 2 views came directly from heavytruckparts.

In the example above, the same PACCAR ENGINE ASSEMBLY shows on two rows, because it had two different types of events. In this case, a user clicked on the part’s Detail View page, and also performed a Map Click on the vendor’s address. We could infer the user might be interested in picking up the part directly.
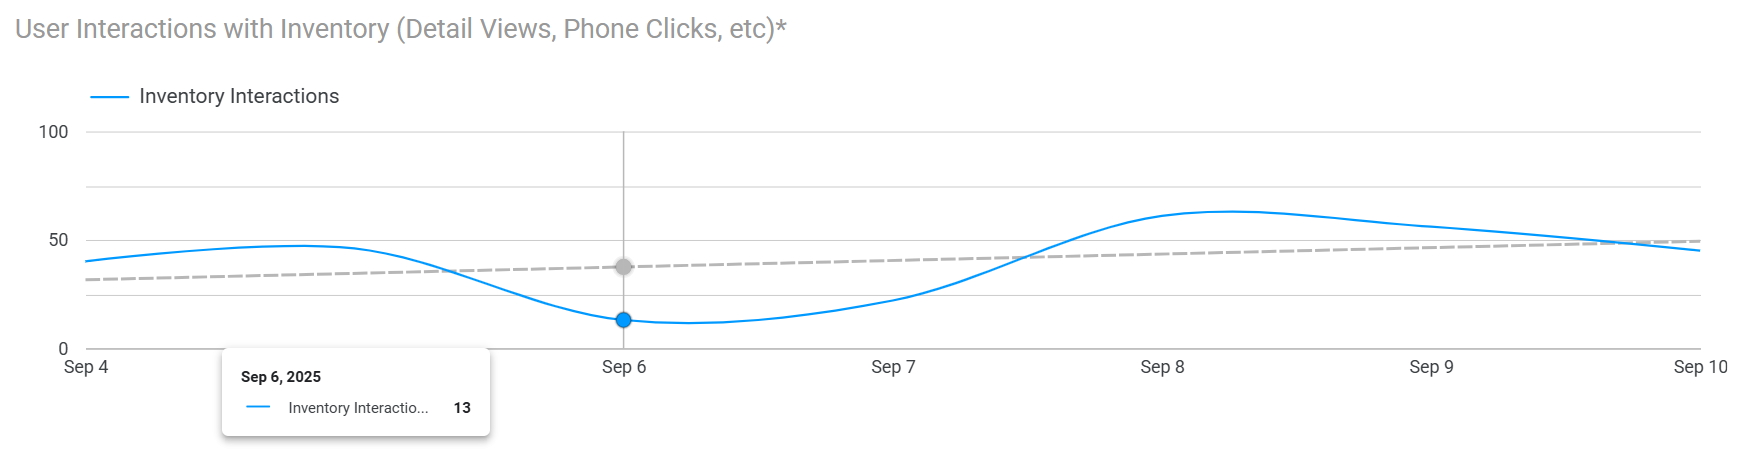
📈 User Interactions Over Time
Near the bottom of this chart you will find a graph of user interactions over time. Hover over a point in the graph to see the numerical value from that day. This graph also supports a trendline, so you can view the overall trend in user interactions.