The HTP Analytics - Views & Users chart gives you an overall report of your listings on HTP, how many people are viewing your parts, and how many views your parts have received within the dates on the chart.
.png?cb=f8ff2a452671433bdc8c5c8cb5fa1e47)
👁️ Views
A View is counted when a user looks at a part’s detail screen. It is not counted when the part shows in search results. A user could open a part from a web search, social media post, searching within HeavyTruckParts.Net, and more. If a user opens a part’s detail screen more than once, it will count as multiple views.
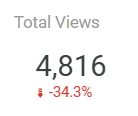
Total Views - Sums the total part detail views in the time period. The comparison below the total indicates how this number has changed since the last time period.
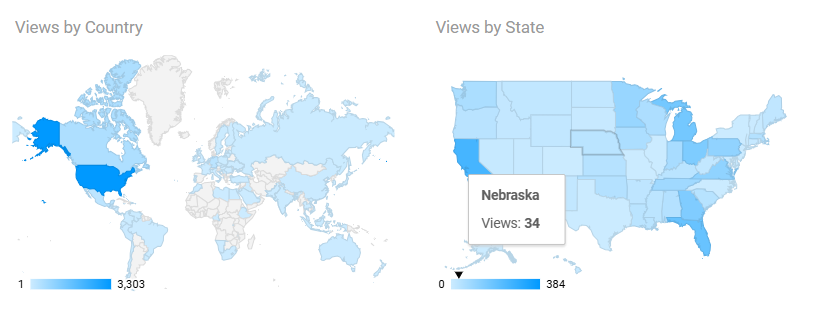
Views by Country and State - Sums the total part detail views in the time period, broken down by geography. Hover over an area on the map to see the total count.
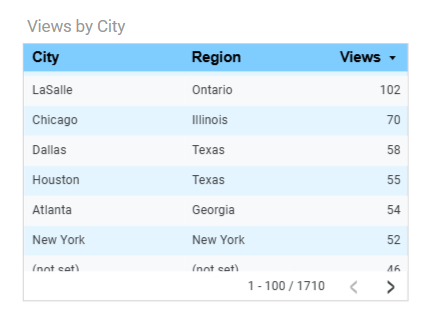
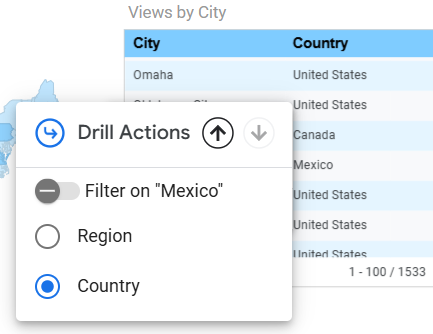
Views by City - Sums the total part detail views in the time period, broken down by city. By default this report shows you the Region (State or Province). Click on any column header to sort by that column.
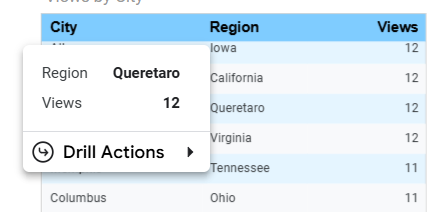
In case you aren’t familiar with province names in other countries, you can click on the Region to change the report to display the Country instead.
Analytic tracking data is imprecise, and some users might opt out of data tracking. In cases where you see views where the location is “Not Set”, that means a user viewed a part but didn’t opt in to tracking data.
👤 Users
A User is counted when a unique individual interacts with a page specific to your yard, such as your vendor page or a part listing.
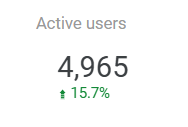
Active Users - The sum of unique individuals who have interacted with either your vendor page or one of your listings. The comparison below the total indicates how this number has changed since the last time period.
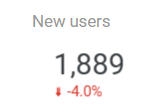
New Users - The sum of unique individuals that have visited HeavyTruckParts.Net for the first time, and have interacted with either your vendor page or one of your listings. The comparison below the total indicates how this number has changed since the last time period.
Analytic tracking data is imprecise, and some users might opt out of data tracking. Google Analytics does not collect specific information about a user, and makes some assumptions based on geography and the user’s IP address.
🕐 Engagement
Engagement refers to the length of time a user has viewed a page.
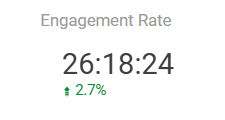
Engagement Rate - The sum of all user viewing time on your listings, represented in Hours, Minutes, and Seconds (HH:MM:SS). The comparison below the total indicates how this number has changed since the last time period.
📈 Views and Users over Time
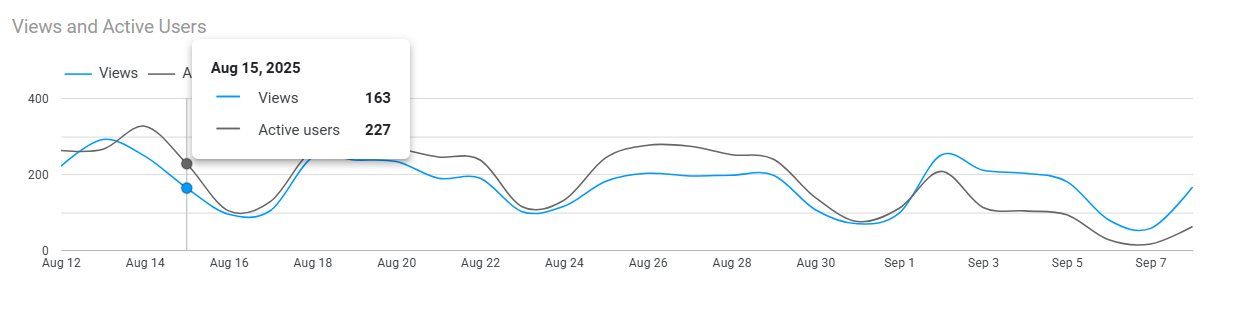
The Views and Active Users chart shows how your total views and total active users change over time. Hover over any date to see a count of each on any given time.